
Visualize insights
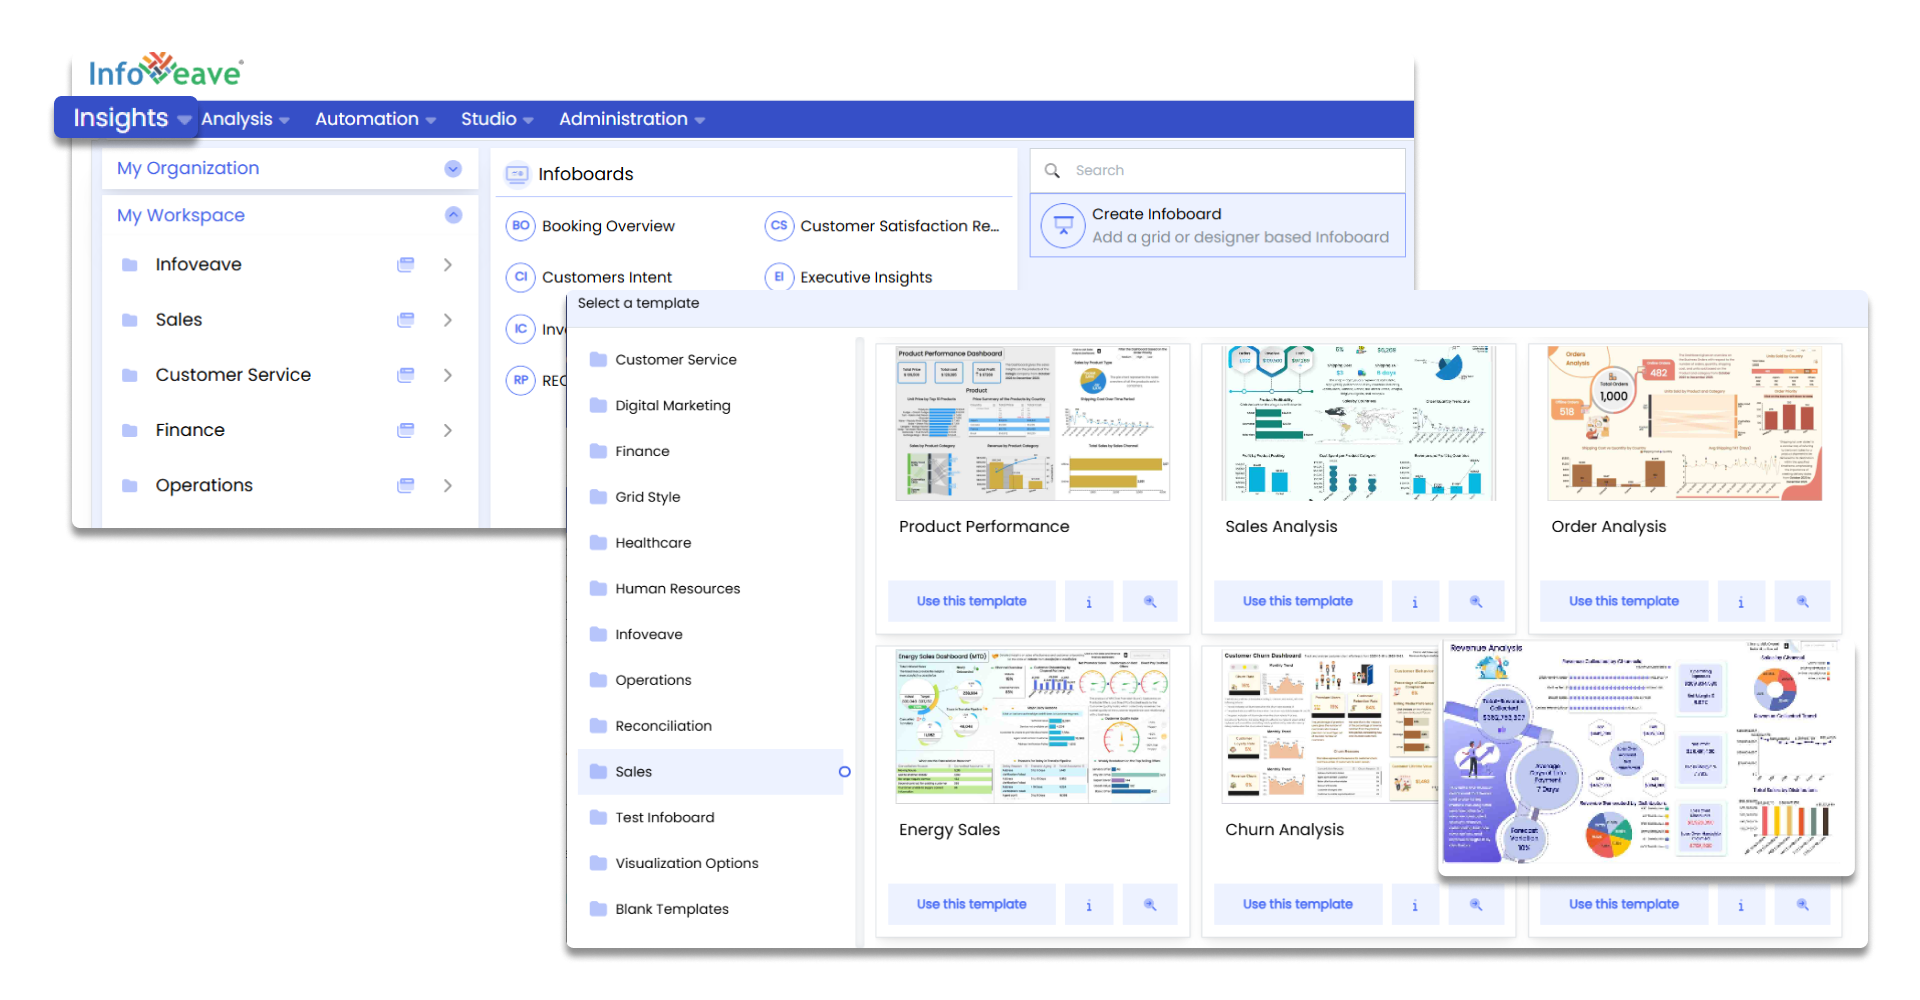
Create Infoboards using templates
- Select an Infoboard that matches your requirementsBrowse through the library and select a template or start with a blank one
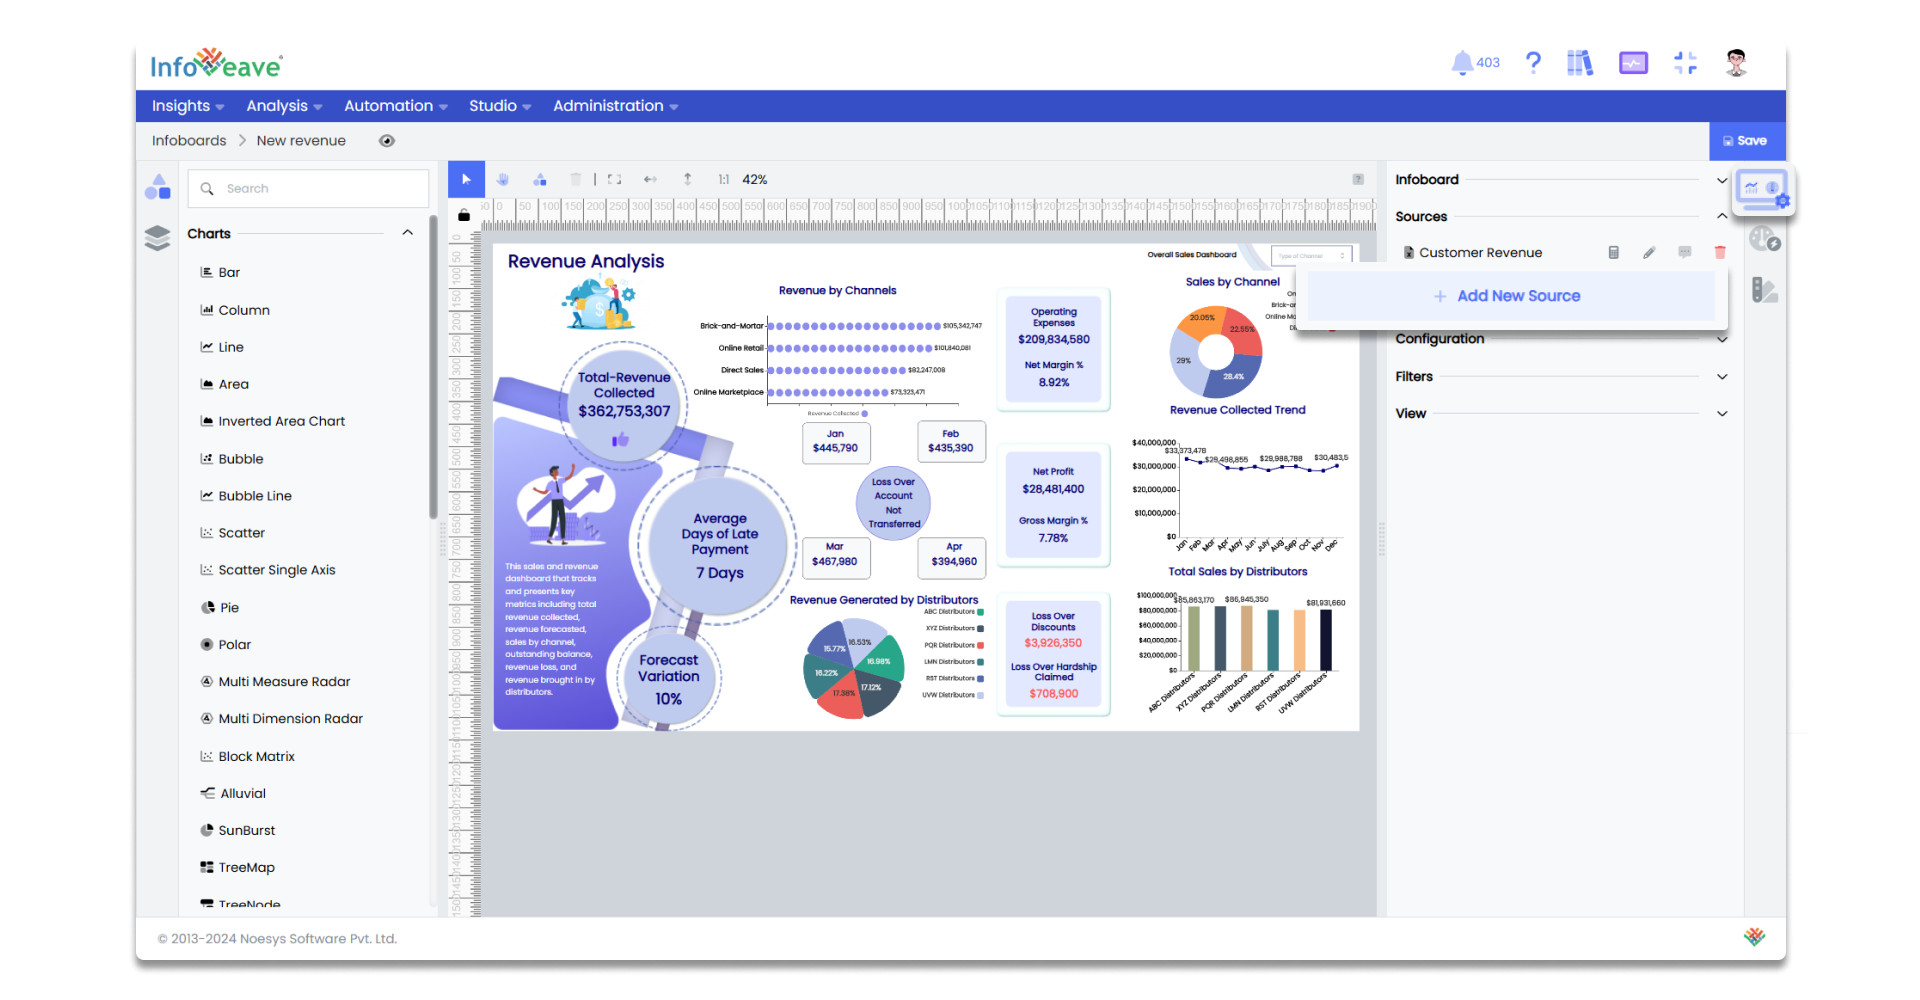
- Link your Infoboard with datasourcesTo link a datasource, click 'Add New Source' and add the 'Sales' datasource
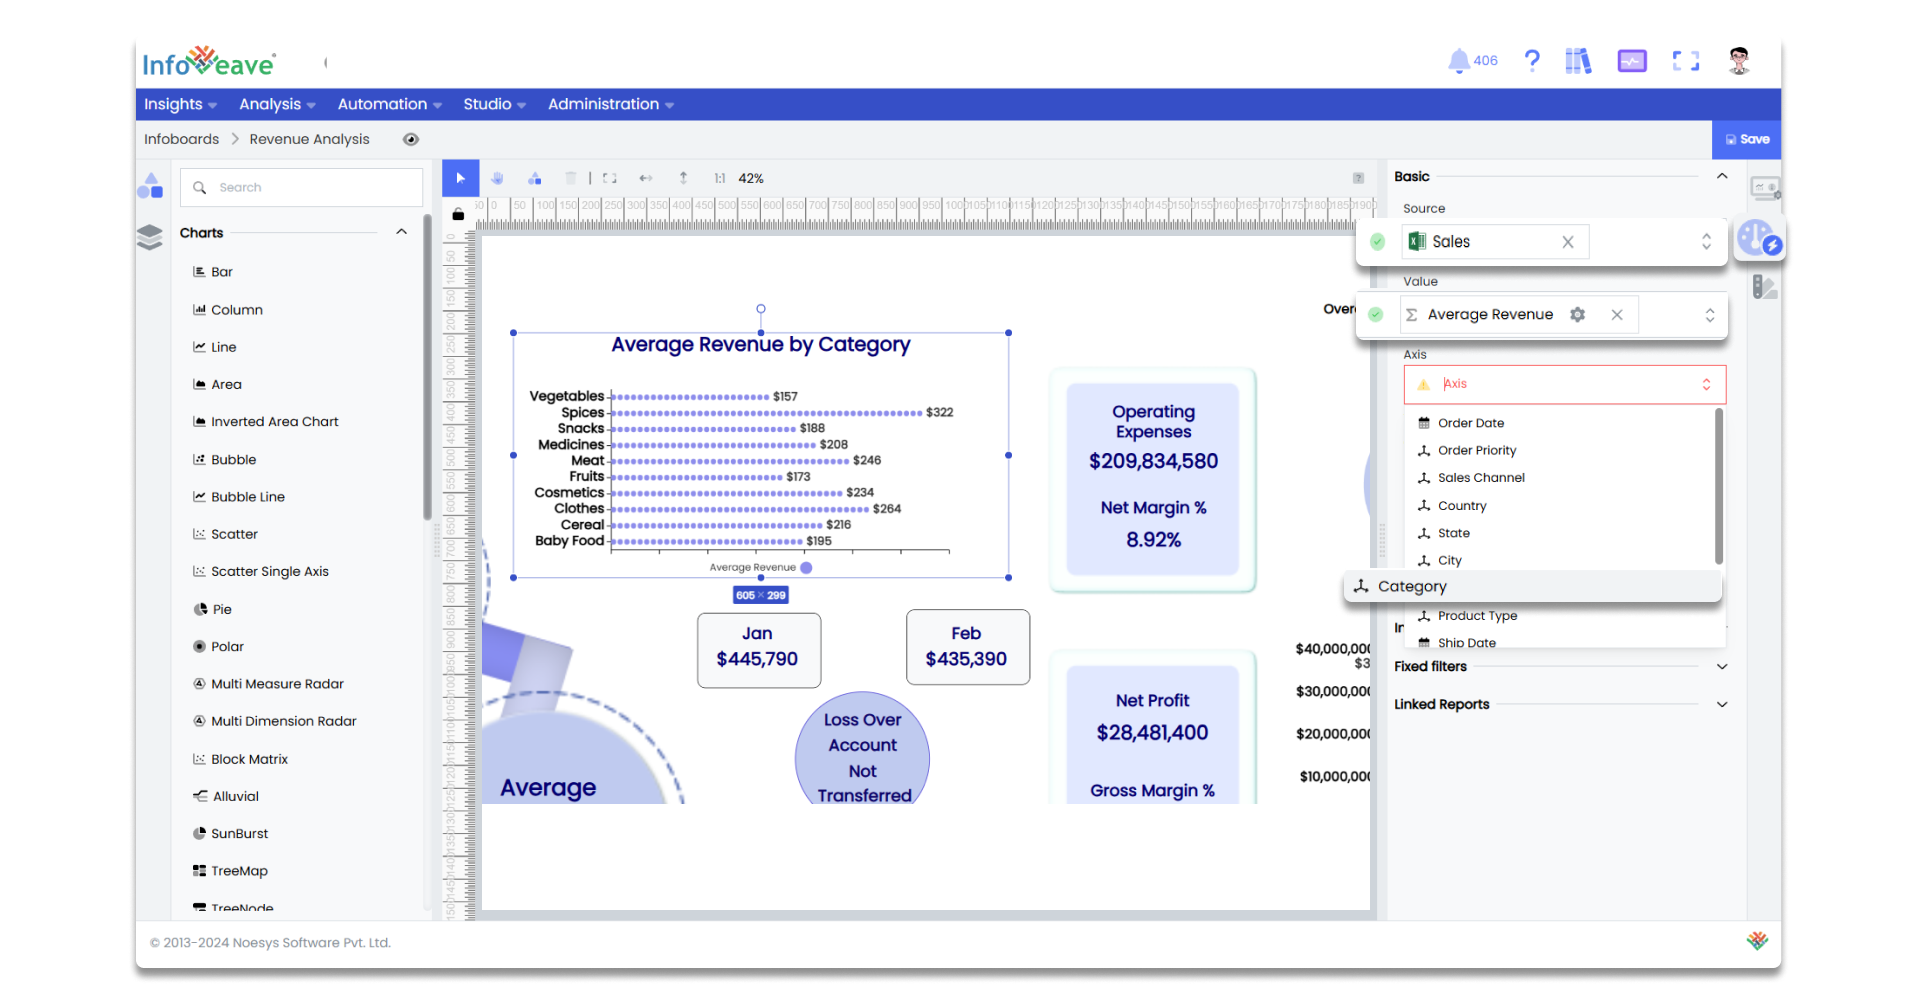
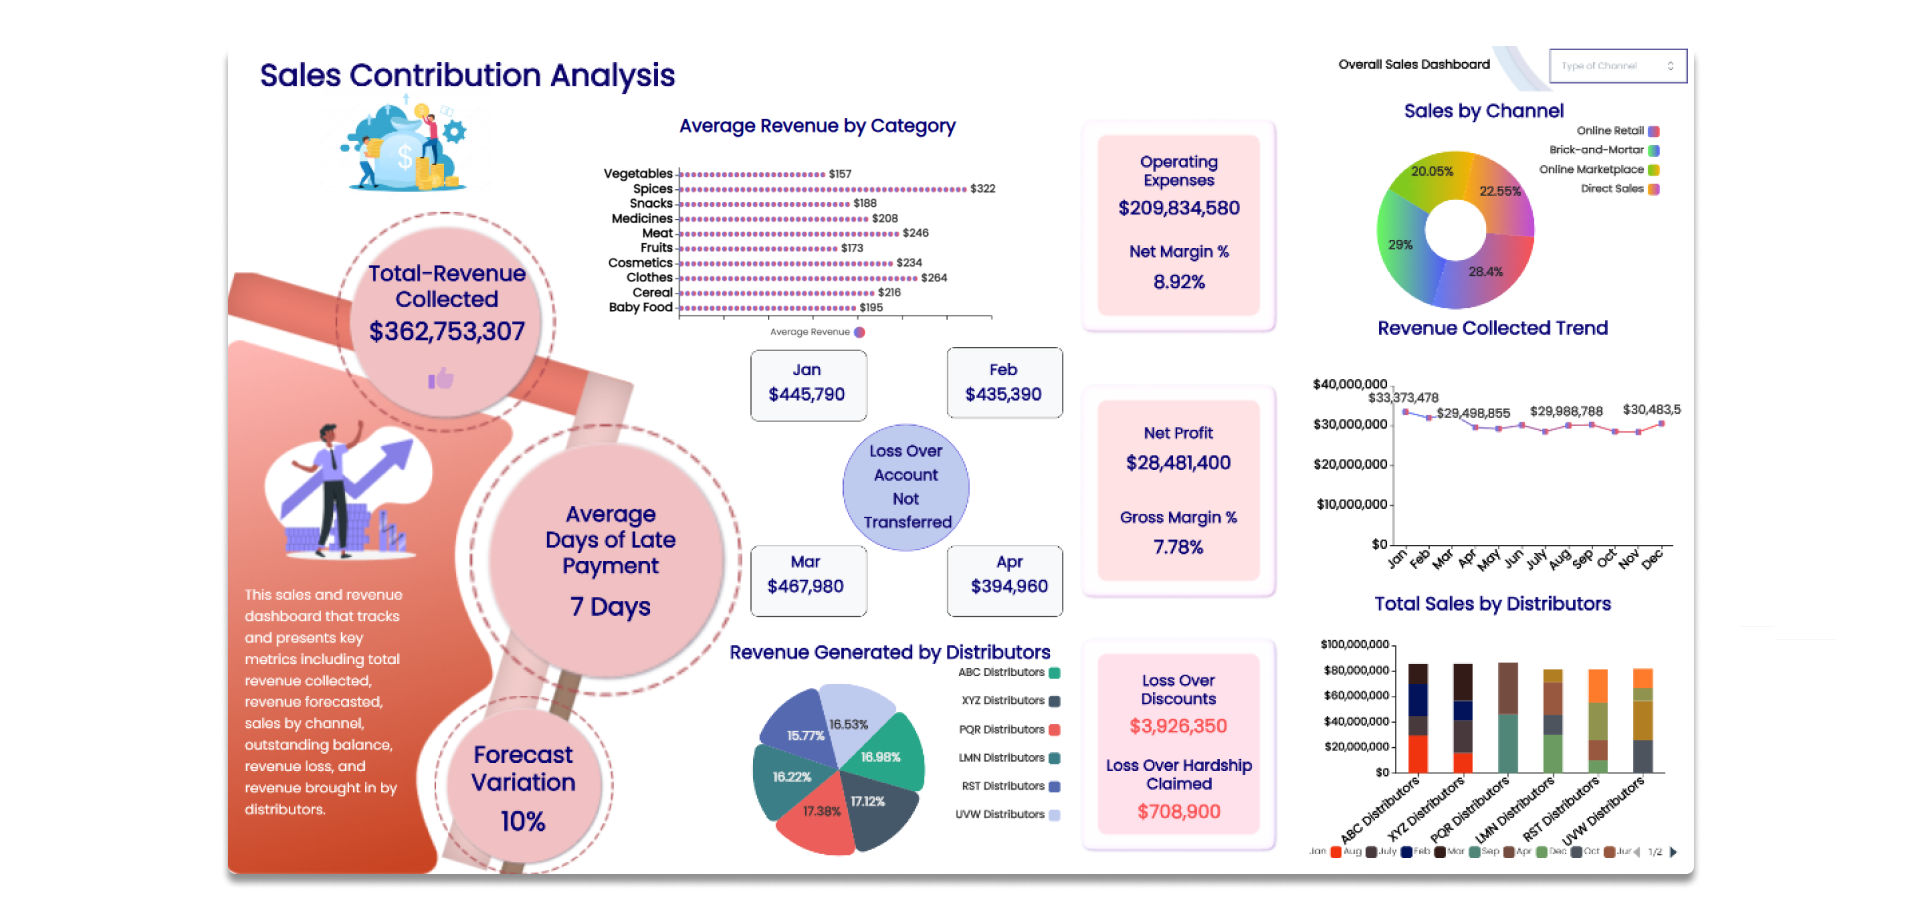
- Configure visualizations with measures and dimensionsFor 'Average Revenue by Category', select 'Sales' as the datasource, 'Average Revenue' as measure and 'Category' as dimension
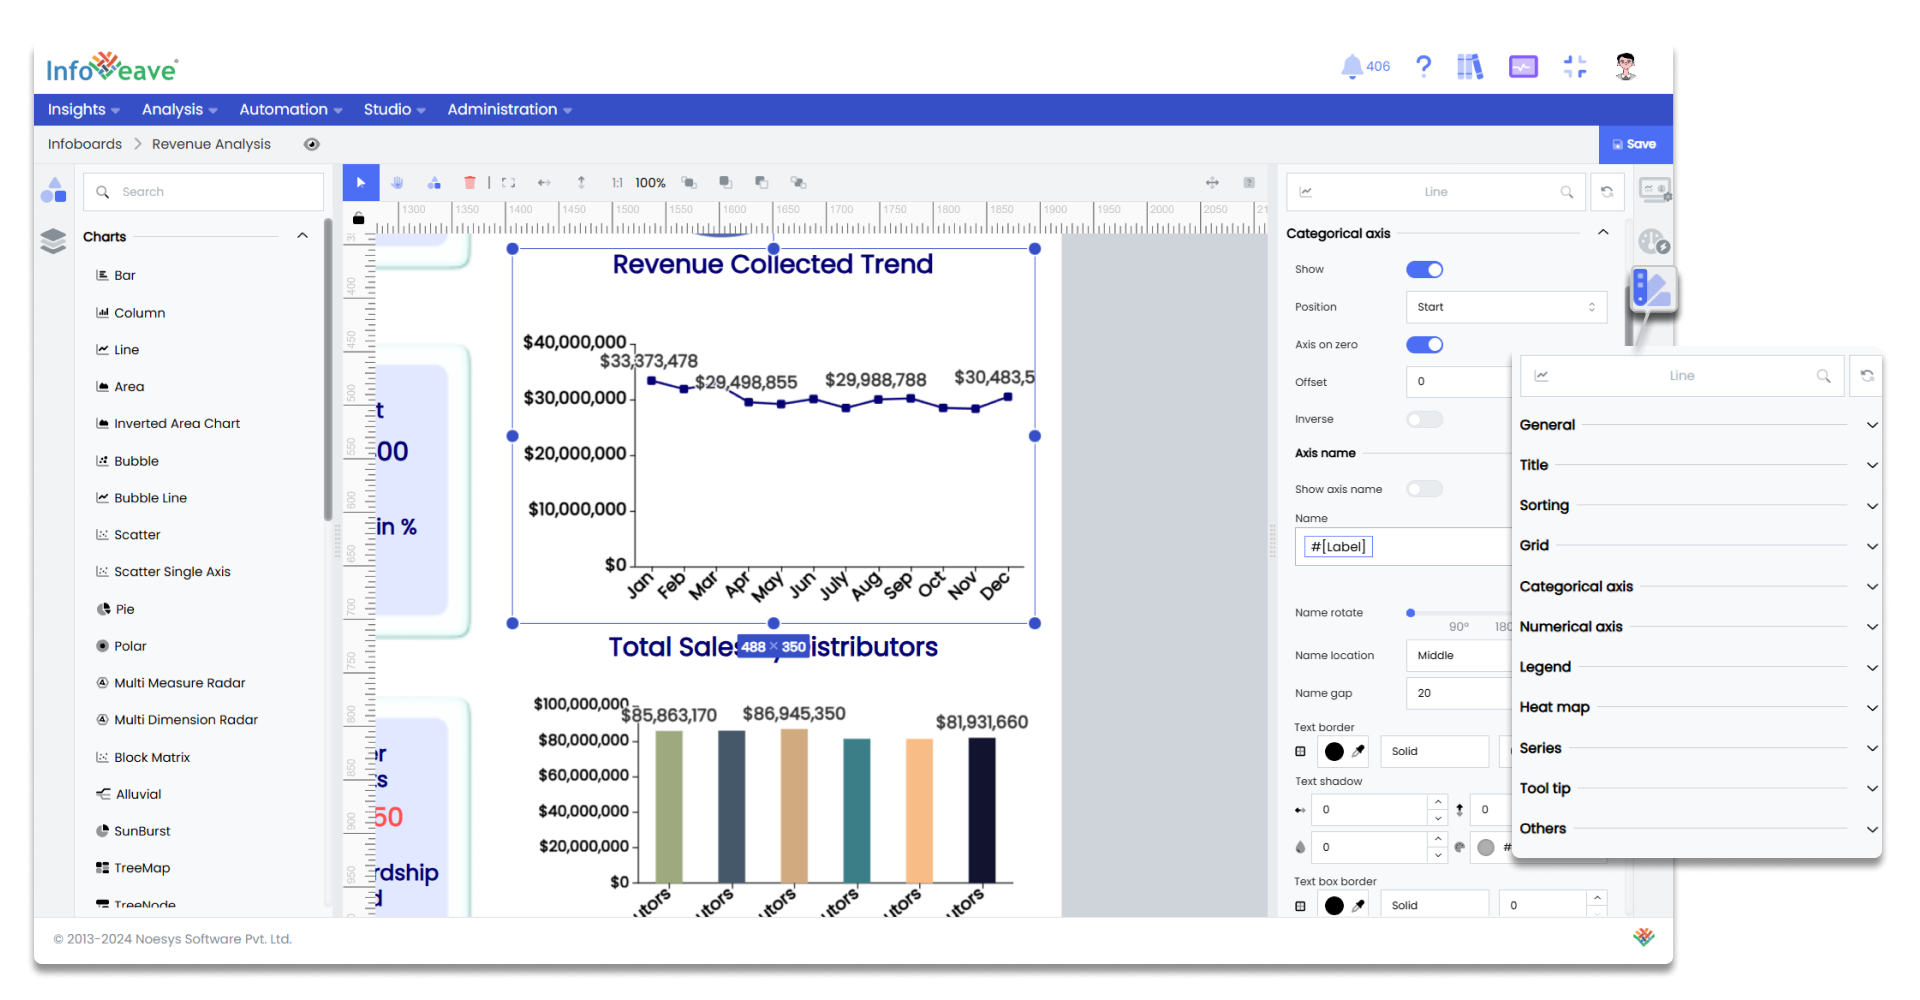
- Customize visualizationsChange axes, labels, colors and other styling options
- Your Infoboard is now ready with visualizations highlighting data trends and patternsBoost user engagement on your Infoboards by adding drilldowns, conditional expressions, sub views, and dynamic interactions
- Done